
Hello I’m DARSHAN PATEL
2
Years Of Experience


5+
Collaborated Teams


BUSINESS ANALYST & DATA VISUALIZATION EXPERT
BUSINESS ANALYST & DATA VISUALIZATION EXPERT
I am a data-focused Business Analyst with hands-on expertise in Power BI, Tableau, SQL, and ArcGIS. From analyzing over 1M+ records to building visual dashboards and driving ETL automation, I specialize in optimizing data pipelines, boosting KPI transparency, and enabling insight-driven decisions. My analytical rigor, documentation skills, and tool-based proficiency make me a valuable asset in turning raw data into strategic advantage.
Darshan Patel
- Business Analyst Hire Me for Your Dreamed Projects
Data Visualization Analyst
Built custom dashboards in Tableau & Power BI, visualizing 30+ KPIs with dynamic filters, enabling 44% faster performance reviews and supporting leadership decision-making.
Process Optimization Specialist
Streamlined business operations by designing automated ETL pipelines and root cause diagnostics, improving data reliability and reducing reporting time by over 50%.
Spatial & BI Consultant
Integrated GIS tools like ArcGIS with business systems to enhance mapping, compliance, and risk tracking—leading to a 36% increase in stakeholder response accuracy.

Web Design
Architecture & Interior Website Design
Elegant, visually striking design showcasing architectural projects and interiors, with smooth navigation and immersive imagery.

App Design
Furniture and Decor Mobile App Design
Elegant, user-friendly app showcasing furniture and decor with seamless browsing and personalized recommendations.
Web Design
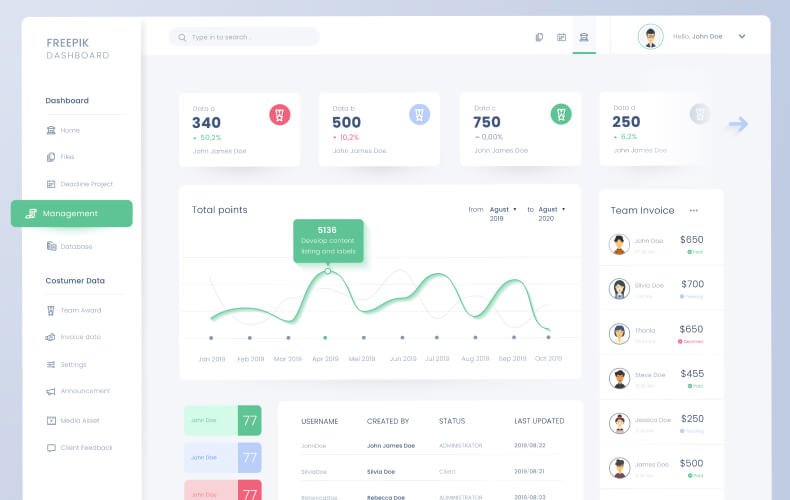
Finance Dashboard Design
Clean, intuitive interface displaying real-time data with interactive charts and easy-to-read financial metrics.
What My Customers Says About Me
Showcases client satisfaction and success achieved through digital marketing expertise.

“Darshan streamlined our reporting process and transformed our KPI tracking. His Tableau dashboards brought new clarity to our reviews and saved us countless hours in performance audits. An analytical thinker and an excellent communicator.”

“Darshan’s ability to dissect large datasets using SQL and build automation pipelines is unmatched. His insights helped us uncover critical data gaps, improving our report reliability by over 40%. A true data-driven professional.”

“Darshan demonstrated outstanding leadership and technical ability during his Tableau and GIS projects. His work showcased precision, creativity, and real-world impact. He consistently exceeded academic expectations with professional-grade results.”